Chapter 13 ~ Non-Renewable Resources
Key Concepts
After completing this chapter, you will be able to:
- Describe the global and Canadian production and use of metals, fossil fuels, and other non-renewable resources.
- Explain the heavy reliance of industrialized economies on non-renewable resources, and predict whether these essential sources of materials and energy will continue to be readily available into the foreseeable future.
- Outline five major sources of energy that are available for use in industrialized countries, and describe the potential roles of these in a sustainable economy.
Introduction
As we noted in Chapter 12, the reserves of non-renewable resources are inexorably diminished as they are extracted from the environment and used in the human economy. This is because non-renewable resources are finite in quantity and their stocks do not regenerate after they are mined. Note that the word reserve has a specific meaning here – it is used to denote a known amount of material that can be economically recovered from the environment (that is, while making a profit).
Of course, continuing exploration may discover previously unknown deposits of non-renewable resources. If that happens, there is an increase in the known reserves of the resource. For example, the world’s known reserves of nickel and copper have been increased during the past two decades because of the discovery of rich deposits of those metals in northern Quebec and Labrador. There are, however, limits to the number of “new” discoveries of non-renewable resources that can be made on planet Earth.
Changes in the value of non-renewable commodities also affect the sizes of their economically recoverable reserves. For example, if the value of gold increases in its marketplace, then it may become profitable to prospect for new stocks in remote places, to mine lower-grade ores, and to reprocess “waste” materials containing small quantities of this valuable metal. An improvement of technology may have the same effect, for instance, by making it profitable to process ores mine that were previously non-economic.
In addition, the life cycle in the economy of some non-renewable resources, particularly metals, can be extended by recycling. This process involves collecting and processing disused industrial and household products to recover reusable materials, such as metals and plastics. However, there are thermodynamic and economic limits to recycling, which means the process cannot be 100% efficient. Furthermore, the demand for non-renewable resources is increasing rapidly because of population growth, spreading industrialization, and improving standards of living along with the associated per-capita consumption. This has resulted in an accelerating demand for non-renewables that must be satisfied by mining additional quantities from the environment.
The most important classes of non-renewable resources are metals, fossil fuels, and certain other minerals such as gypsum and potash. The production and uses of these important natural resources are examined in the following sections.
Metals
Metals have a wide range of useful physical and chemical properties. They can be used as pure elemental substances, as alloys (mixtures) of various metals, and as compounds that also contain non-metals. Metals are used to manufacture tools, machines, and electricity-conducting wires; to construct buildings and other structures; and for many other purposes. The most prominent metals in industrial use are aluminum (Al), chromium (Cr), cobalt (Co), copper (Cu), iron (Fe), lead (Pb), manganese (Mn), mercury (Hg), nickel (Ni), tin (Sn), uranium (U), and zinc (Zn). The precious metals gold (Au), platinum (Pt), and silver (Ag) have some industrial uses (such as conductors in electronics), but are valued mostly for aesthetic reasons, particularly to manufacture jewelry. Some of the more common metal alloys are brass (containing at least 50% Cu, plus Zn), bronze (mostly Cu, plus Sn and sometimes Zn and Pb), and steel (mostly Fe, but also containing carbon, Cr, Mn, and/or Ni). Metals are mined from the environment, usually as minerals that also contain sulphur or oxygen. Deposits of metal-bearing minerals that are economically extractable contribute to the known reserves of metals. An ore is an assortment of minerals that are mined and processed to manufacture pure metals. The stages in metal mining, processing, manufacturing, and recycling are summarized in Figure 13.1.
Figure 13.1. Metal Mining and Use. This diagram shows major stages of the mining, manufacturing, use, and re-use of metals, as well as the associated emissions of waste gases and particulates to the environment. Overall, the diagram represents a flow-through system, with some recycling to extend the lifetime of metals within the economy. Source: Modified from Freedman (1995).

Ore extraction by mining is the initial step in the process of bringing is metals into the material economy. This may be conducted in surface pits or strip mines, or in underground shaft-mines that may penetrate kilometers underground. In an industrial facility called a mill, the ore is crushed to a fine powder by heavy steel balls or rods within huge rotating tumblers. The ground ore is then separated into a metal-rich fraction and a waste known as tailings. Depending on the local geography, the waste tailings may be discarded onto a contained area on land, into a nearby lake, or into the ocean (see Chapter 18).
If the metal-rich fraction contains sulphide minerals, it is next concentrated in a smelter by roasting at high temperature in the presence of oxygen. This releases gaseous sulphur dioxide (SO2) while leaving the metals behind. The concentrate from the smelter is later processed into pure metal in a facility called a refinery. The pure metal is then used to manufacture industrial and consumer products. The SO2 may be processed into sulphur or sulphuric acid that can be used in various other industrial processes, or it may be released to the environment as a pollutant.
After the useful life of manufactured products has ended, they can be recycled back into the refining and manufacturing processes, or they may be discarded into a landfill.
High-quality ores are geologically uncommon. The deposits that are most economic for mining are typically located fairly close to the surface, and the ores have a relatively high concentration of metals. However, the thresholds vary depending on the value of the metal being processed. Ores with very small concentrations of gold and platinum can be economically mined because these metals are extremely valuable (per unit of weight). In contrast, less-valuable aluminum and iron must be mined as richer ores, in which the metals are present in high concentrations.
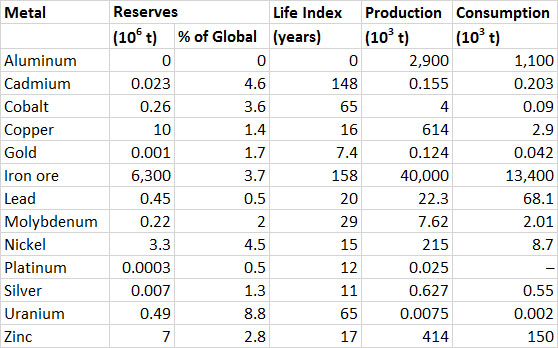
Data showing the global production of industrially important metals are given in Table 13.1. Note that for most metals the amounts consumed are somewhat larger than the annual production; this indicates that some of the consumption involves recycled material that has been reclaimed from previous uses. Also note the large increase in production of most metals since 1977. Iron and aluminum are the metals produced and used in the largest quantities. The life index (or production life, calculated as the known reserves divided by the annual rate of production) of aluminum is about 592 years, and for iron ore it is 58 years (Table 13.1). Life indexes for other metals listed in the table are less, which suggests that their known reserves are being quickly depleted. It is important to remember, however, that those known reserves are increased by new discoveries, changes in technology, and more favourable economics for the resource.
Table 13.1. Global Production, Consumption, and Reserves of Selected Metals. Data from: U.S. Bureau of Mines (1977) and U.S. Geological Survey (2014).

Canada is one of the world’s leading producers of metals, accounting for 15% of the global production of nickel in 2006, 9% of aluminum, and 6% zinc (Tables 13.1 and 13.2). Much metal production is intended for export. Domestic consumption is about 39% of the value of production of all metals (Table 13.2). Metal-ore mining contributed $17-bilion to the GDP of Canada in 2011, and support activities (such as prospecting) another $4-billion, for a total of 1.3% of the GDP (Statistics Canada, 2014a).
The reserve life (life index) of Canadian reserves of metals is similar to or shorter than their global values (Table 13.2). Canadian reserves make up 15% of the global reserves of uranium and 5–10% of those of cadmium, nickel, silver, and zinc.
Table 13.2. Reserves, Production, and Consumption of Selected Metals in Canada, 2012. Note that bauxite (aluminum ore) is not mined in Canada, but large amounts are imported for processing. Data from: Natural Resources Canada (2014a) and U.S. Geological Survey (2014).
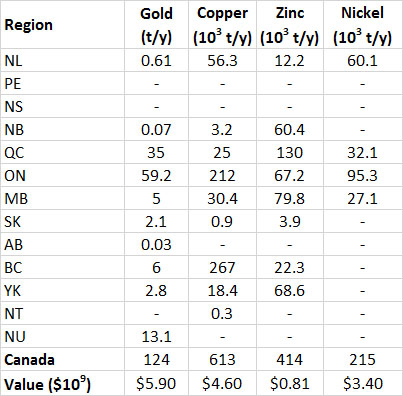
Table 13.3. Provincial Production of Selected Metals in Canada, 2013. Data from: Natural Resources Canada (2014a)
Fossil Fuels
Fossil fuels include coal, petroleum, natural gas, oil-sand, and oil-shale. These materials are derived from the partially decomposed biomass of dead plants and other organisms that lived hundreds of millions of years ago. The ancient biomass became entombed in marine sediment, which much later became deeply buried and eventually lithified into sedimentary rocks such as shale and sandstone. Deep within those geological formations, under conditions of high pressure, high temperature, and low oxygen, the organic matter transformed extremely slowly into hydrocarbons (molecules that are composed only of carbon and hydrogen) and other organic compounds. In some respects, fossil fuels can be considered to be a form of stockpiled solar energy – sunlight that was fixed by plants into organic matter and then stored geologically.
Image 13.1. Because petroleum and other fossil fuels are non-renewable resources, their future reserves are diminished when they are extracted from the environment. This is an oil pump in southeastern Saskatchewan. Source: B. Freedman.

In a geological sense, fossil fuels are still being produced today, by the same processes that involve dead biomass being subjected to high pressure and temperature. Because the natural geological production of fossil fuels continues, it might be argued that these materials are a kind of renewable resource. However, the rate at which fossil fuels are being extracted and used is enormously faster than their extremely slow regeneration. Under this circumstance, fossil fuels can only be regarded as being non-renewable.
Hydrocarbons are the most abundant chemicals in fossil fuels. However, many additional kinds of organic compounds may also be present, which incorporate sulphur, nitrogen, and other elements in their structure. Coal in particular is often contaminated with many inorganic minerals, such as shale and pyrite.
The most important use of fossil fuels is as a source of energy. They are combusted in vehicle engines, power plants, and other machines to produce the energy needed to perform work in industry, for transportation, and for household use. Fossil fuels are also used to produce energy to heat indoor spaces, an especially important function in countries with a seasonally cold climate. Another key use is for the manufacturing of synthetic materials, including almost all plastics. In addition, asphaltic materials are used to construct roads and to manufacture roofing shingles for buildings.
Coal is a solid material that can vary greatly in its chemical and physical qualities. The highest quality coals are anthracite and bituminous, which are hard, shiny, black minerals with a high energy density (the energy content per unit of weight). Lignite is a poorer grade of coal, and it is a softer, flaky material with a lower energy density. Coal is mined in various ways. If deposits occur close to the surface, they are typically extracted by strip-mining, which involves the use of huge shovels to uncover and collect the coal-bearing strata, which are then transported using immense trucks. Deeper deposits of coal are mined from underground shafts, which may follow a seam kilometers into the ground. Most coal in North America is extracted by strip-mining.
After it is mined, coal may be washed to remove some of the impurities and then ground into a powder. Most is then combusted in a large industrial facility, such as a coal-fired generating station, a use that accounts for about half of the global use of coal and 88% in Canada (Natural Resources Canada, 2014b). In addition, about 75% of the world’s steel is manufactured using coal as an energy source, often as a concentrated material known as coke. Coal can also be used to manufacture synthetic petroleum.
Petroleum (crude oil) is a fluid mixture of hydrocarbons with some impurities, such as organic compounds that contain sulphur, nitrogen, and vanadium. Petroleum from different places varies greatly, from a heavy tarry material that must be heated before it will flow, to an extremely light fluid that quickly volatilizes into the atmosphere. Petroleum is mined using drilled wells, from which the liquid mineral is forced to the surface by geological pressure. Often, the natural pressure is supplemented by pumping.
A heavy form of petroleum called bitumen is also produced by mining and refining oil- sand, which is extracted in northern Alberta. Oil-sand deposits that are close to the surface are mined in immense open pits, while deeper materials are treated with steam so they will flow and are then extracted as a heavy liquid using drilled wells.
Once extracted, petroleum is transported by overland pipelines, trucks, trains, and ships to an industrial facility known as a refinery, where the crude material is separated into various constituents. The fractions may be used as a liquid fuel, or they can be manufactured into many useful materials, such as plastics and pigments. The refined fractions include the following:
- a light hydrocarbon mixture known as gasoline, which is used to fuel automobiles
- slightly heavier fractions, such as diesel fuel used by trucks and trains and a home-heating fuel
- kerosene, which is used for heating and cooking and as a fuel for airplanes
- dense residual oils, which are used as a fuel in oil-fired power plants and in large ships
- semi-solid asphalts that are used to pave roads and manufacture roofing products
Natural gas is also extracted using drilled wells. The dominant hydrocarbon in natural gas is methane, but ethane, propane, and butane are also present, as often is hydrogen sulphide. Most natural gas is transported in steel pipelines from the well sites to distant markets. Sometimes it is liquefied under pressure for transportation, particularly by ships. In Canada, however, it is distributed mostly through an extensive network of pipelines. Natural gas is used to generate electricity, to heat buildings, to cook food, to power light vehicles, and to manufacture nitrogen fertilizer.
Image 13.2. Continued exploration for non-renewable resources can discover new reserves. Because Earth is finite, however, there are limits to these discoveries, which are being approached rapidly. This enormous off-shore production platform was constructed to develop the Hibernia petroleum deposit on the Grand Banks off Newfoundland. Source: Dosya: Hibernia platform, Wikipedia Commons; http://tr.wikipedia.org/wiki/Dosya:Hibernia_platform.jpg

Production, Reserves, and Consumption
The global production and reserves of fossil fuels are shown in Table 13.4. The production of petroleum increased by 29% between 1993 and 2013, natural gas by 64%, and coal by 83%. There is active exploration for all these fuels, and additional reserves are being discovered in various regions of the world. Fossil fuels are, however, being consumed extremely rapidly, particularly in developed and rapidly developing economies. Consequently, the expected lifetimes of the known reserves are alarmingly short, equivalent to 113 years for coal, 55 years for natural gas, and 58 years for petroleum.
These numbers should not be interpreted too literally, however, because ongoing exploration is discovering additional deposits, which add to the known reserves. This is illustrated by changes in the calculated reserve life of petroleum, which was 46 years in 1993, but twenty years later had actually increased to 58 years. Of course, this seemingly unexpected result is due to the fact that previously unknown reserves of petroleum had been discovered during that 20-year period, or rising prices had made once-uneconomic resources viable (such as the oil-sands of Alberta). Nevertheless, the discoveries will be limited by the finite amounts present on Earth, so the fact remains that the stocks of these non-renewable resources are being depleted rapidly.
Table 13.4. Global Production and Reserves of Fossil Fuels, 2013. “Proven” reserves are the total amounts of a resource that are known to exist. The reserve life is the reserves divided by the annual rate of extraction. Source: Data from British Petroleum (2014)
(1) toe = tonnes of oil equivalent, which allows all of the fossil fuels to be expressed in comparable units (2) The reserves and production of natural gas are in 1012 m3
At the present time, petroleum is the world’s most important fossil fuel resource, largely because it can easily be refined into portable liquid fuels that are readily used as a source of energy for many industrial and domestic purposes. In addition, petroleum is the major feedstock used to manufacture plastics and other synthetic materials.
About 46% of the world’s proven recoverable reserves of petroleum occurs in the Middle East (Table 13.5). This fact underscores the strategic importance of that region to the global energy economy and its security. Saudi Arabia alone has 16% of the world’s petroleum reserves, followed by Iraq, Iran, and Kuwait each with 6-9%. Note that the large reserves cited for Venezuela and Canada are largely for “non-conventional” sources of petroleum, such as very-heavy oil and oil-sand (respectively), which are relatively expensive to mine and refine. The world’s most developed economies are in Europe, North America, and eastern Asia. Those in Europe and Asia depend heavily on petroleum imports from the Middle East, Russia, and Venezuela to maintain their consumption levels. This was once also the case for North America, but it has been much less so since about 2010 because of large increases in domestic production associated with petroleum in shale formations and oil-sand in northern Alberta.
The world’s best-endowed countries in terms of total fossil-fuel resources are Russia and the United States, both of which have enormous reserves of natural gas, coal, and petroleum (Table 13.5).
Table 13.5. Reserves of Fossil Fuels in Selected Countries. The countries are listed in order of decreasing reserves of petroleum in 2013. Data are proven reserves, and are from British Petroleum (2008)

The production lives of proven recoverable Canadian reserves of fossil fuels are shown in Table 13.6. Remember, however, that the amount of the reserves is affected by new discoveries, the advent of technologies that make previously unrecoverable stocks economically viable, as well as increases in commodity prices that make it profitable to utilize once-marginal resources. In Canada, this has recently been the case of the oil-sand resource. Examination of the history of petroleum resources in Canada shows a remarkable jump in 1999, when the stocks made an leap from a value of 8.0-million tonnes (toe) in 1998, to 29.3-million toe the following year (BP, 2014). This immense increase of 265% occurred because resource analysts became convinced that the rapidly developing technologies for mining the immense oil-sand resource were economically viable, coupled with a rising value for petroleum, which also bolstered the case for developing the resource.
Most reserves of fossil fuels in Canada occur in the western provinces, as does most of the production (Table 13.7). In addition to conventional petroleum, Canada has a huge resource of oil-sand, from which a heavy bitumen is extracted that is upgraded to a synthetic petroleum (see Canadian Focus 13.1). There are about 14 million hectares of oil-sand deposits in northern Alberta, and the areas presently under development can potentially yield about 3.2 billion tonnes of synthetic oil (BP, 2014).
Table 13.6. Production, Consumption, and Reserves of Fossil Fuels in Canada, 2013. Percentage consumption refers to the fraction of Canadian production that is used within Canada. The reserve life is the proven reserves divided by the annual production. Source: Data from British Petroleum (2014)
(1) toe
Table 13.7. Provincial Production of Fossil Fuels, 2012. Where data are missing, the production was zero or small and not reported. Source: Data from Statistics Canada (2014b).

About 67% of the Canadian production of natural gas is consumed domestically, the rest being exported to the United States (Table 13.6). Similarly, about 55% of the coal production and 54% of petroleum is used domestically. However, these national data hide some important regional differences. In particular, a large fraction of the petroleum extracted in western Canada is exported to the United States, but this is offset by a substantial import of foreign oil to the eastern provinces. Overall, while Canada produced about 193-million (106) tonnes of petroleum in 2013, it consumed 104 x 106 t, exported 163 x 106 t, and imported 153 x 106 t (BP, 2014). The production value of crude oil was $45 billion in 2013, while that of oil-sand bitumen and its synthetic petroleum was $57 billion, and natural gas $16 billion (CAPP, 2014). That of coal was $4.6 billion (NRC, 2014b). Canada produces about 5% of the global production of natural gas, 5% of the petroleum, and 1% of the coal (BP, 2014). These are much larger than the 0.5% of the global population that lives in Canada.
Canadian Focus 13.1. The Oil Sands of Alberta
Oil-sand is a fossil-fuel resource that consists of a mixture of sand and clay with interstitial bitumen at a concentration of 10-12%. (Technically, these deposits are most accurately referred to as bitumen-sand, but sometimes the derogatory term of tar-sand is used.) Oil-sand occurs over a 140,000 km2 region of northern Alberta and, to a much lesser extent, in nearby Saskatchewan. Comparable deposits also occur in Venezuela.The oil-sand resource of Alberta is immense. The total reserve is about 27.3-billion tonnes of petroleum equivalent (168-billion barrels), but the resource under “active development” in 2013 was 4.2-billion t (British Petroleum, 2014). For comparison, Saudi Arabian reserves of conventional petroleum, the largest in the world, are about 36.5-billion t.
In 2012, the production of crude bitumen plus synthetic petroleum in Alberta was 89.8-million tonnes, which was equivalent to 76% of the province’s total oil production and 58% of Canada’s (Statistics Canada, 2014c). About two-thirds of the petroleum is typically refined into gasoline and other liquid fuels, and the rest is used as asphalt to build roads and to manufacture roofing products.
Development of the oil-sand resource has moved quickly since the first activity began in the late 1960s. Between 1996 and 2013, a total of $376 billion was invested in new and ongoing projects, with $59 billion in 2013 alone (CAPP, 2014). In 2013, there were 13 oil-sand extraction projects. Assuming that the pace of development continues apace, comparably large investments will continue to be made over the next decade or so, especially if prices for crude oil remain high (most oil-sand operations need a selling point of about $80 per barrel to be economically viable). Most of the frenetic development is occurring near Fort McMurray, which has rapidly grown from a village in the 1960s to about 72-thousand in 2014.
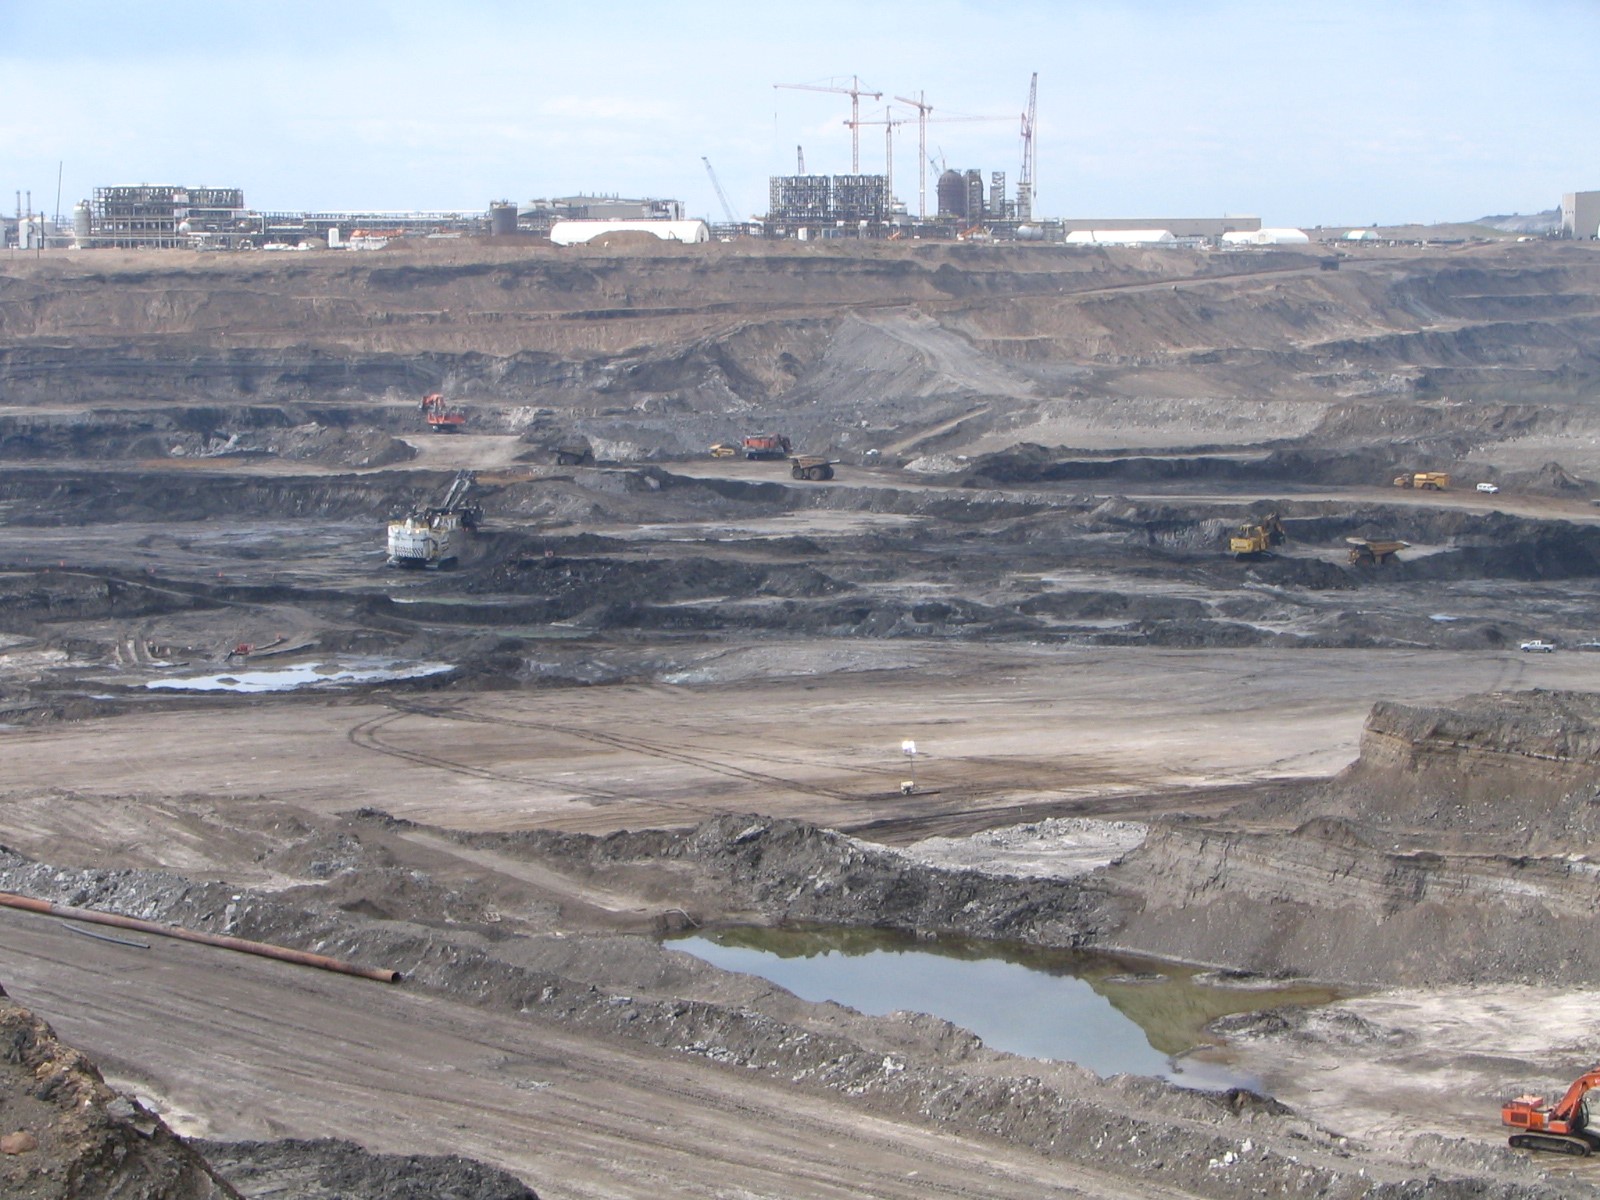
Deposits of oil-sand that occur near the surface (less than about 75 m deep) are mined in open pits (strip-mined) using immense shovels, which along with the trucks they load, are the largest such machines in the world. The raw oil-sand is processed using heat and steam to yield a viscous bitumen (its room-temperature consistency is similar to molasses). The bitumen is modified with light hydrocarbon fluids to reduce its viscosity so that it can flow and be transported in a pipeline. The typical yield from mined oil sand is about 1 t of synthetic petroleum from 15 t of raw resource. About 75-90% of the bitumen present is recovered by the extraction process. The remainder, along with massive quantities of tailings (processed sand and clay), is back-filled into the huge quarries. Once the back-filled areas are filled, they will be contoured, top-dressed with previously stockpiled overburden (gravel, sand, clay, and organic muck from muskeg), and planted to restore a land-use for pasture or as forest. The industry is required to rehabilitate mined sites to a level of productivity at least that of the pre-existing ecosystem. Ultimately, about 20% of the total oil-sand resource lies close enough to the surface to potentially be extracted by open-pit mining. However, because this method was the first to be developed, about two-thirds of the recent production of oil-sand bitumen is from surface mines.
The other one-third of oil-sand bitumen production is from in situ (“in place”) extraction of deposits deeper than 75 m. This is done in various ways, such as injecting steam into the deposit and then pumping the liquefied bitumen to the surface for further processing. Alternative extraction methods include the use of injected solvents to make the bitumen flowable so that it can be pumped to the surface. About 80% of the oil-sand reserves are potentially recoverable by in situ technology, which results in much less disturbance of the surface environment, compared with open-pit mining.
Image 13.3. View of an open-pit mine for the extraction of bitumen-sand in northern Alberta. Source: B. Freedman.
Oil-sand mining and processing are energy-intensive activities that take place in huge industrial facilities. The energy to run machinery and processing facilities is obtained by burning fossil fuels, particularly natural gas, so the industry is a major emitter of greenhouse gases. The oil-sand industry has voluntarily committed to major investments in improved technology to decrease their intensity of energy use and CO2 emissions (see Canadian Focus 17.1.) By decreasing the energy intensity of their operations, the industry will emit smaller amounts of greenhouse gases per tonne of bitumen and synthetic that they produce. Nevertheless, because of the rapidly increasing scale of oil-sand operations in northern Alberta, there will be a large increase in the total amount of emissions. In fact, the growth of the oil-sand industry is responsible for most of the increase in Canadian emissions of greenhouse gases over the past decade or so.
There are additional important environmental effects of the mining and processing of oil sands. They include pollution of the atmosphere, groundwater, and surface water; the extensive destruction of natural habitats; and socio-economic disruptions of rural and Aboriginal communities. In the larger context, however, these damages must be viewed as an inevitable result of the apparent enthusiasm of Canadian society, politicians, and business interests to mine, sell, and use fossil-fuel resources at a rapid (and non-sustainable) rate. This is happening because of the perceived importance of these activities to the domestic and export economies of Canada.
Other Minerals
Other materials that are mined in large quantities in Canada include asbestos, diamonds, gypsum, limestone, potash, salt, sulphur, aggregates, and peat. Except for diamonds, these materials have a smaller commodity value (value per tonne) than metals and fossil fuels. Global or Canadian shortages of these materials are not imminent. The mining of these kinds of minerals contributed $11-bilion to the GDP of Canada in 2011 (Statistics Canada, 2014a).
Asbestos refers to s a group of tough, fibrous, incombustible silicate minerals that are used to manufacture fireproof insulation, cement additives, brake linings, and many other products. However, certain kinds of asbestos minerals have been linked to human health problems, particularly lung diseases. These hazards have greatly reduced the market for this otherwise useful mineral. As recently as 2010 about 0.18-million tonnes of asbestos were mined in Quebec, but the last two mines closed in 2011 (NRC, 2014a).
Diamonds are relatively new to the mining scene in Canada, with the first major discoveries not made until the 1990s. About 10.6-million carats of diamonds were mined in 2013, with a value of $2.0 billion. Almost all mining occurs in the Northwest Territories, with some also in Ontario, and with exploration elsewhere on the Canadian Shield.
Gypsum, a mineral composed of calcium sulphate, is used to manufacture plaster and wallboard for the construction industry. About 2.7-million tonnes of gypsum were mined in 2013, with a value of $38 million. All gypsum mining occurs in Nova Scotia.
Limestone is a rock composed of calcium carbonate. It is used to manufacture cement, as well as lime for making plaster. In addition, some limestone, and the related metamorphic rock known as marble, is quarried for use as building stone and facings. About 18-million tonnes of limestone were mined in 2013. It was used to make 11.8-million tonnes of cement with a value of $1.6 billion. Another 1.8-million tonnes of lime were manufactured, with a value of $306 million. Ontario, Quebec, and British Columbia have the largest cement industries, and Ontario the largest lime-making capacity.
Potash is a rock formed from the mineral potash feldspar, and it is mined to manufacture potassium-containing fertilizer. About 10.1-million tonnes of potash (K2O) were mined in 2013, with a value of $6.1 billion. Potash is mined in Saskatchewan and New Brunswick.
Salt, or sodium chloride, is used in the chemical manufacturing industry, for de-icing roads, as “table salt,” and as a food additive and flavouring. About 12.4-million tonnes of salt were mined in 2013, with a value of $645 million. The largest salt mines are in Ontario, Alberta, Saskatchewan, and Nova Scotia.
Sulphur is manufactured from hydrogen sulphide obtained from sour-gas wells (gas wells rich in H2S), from pollution-control scrubbers (for SO2) at metal smelters, and from deposits of native (or elemental) sulphur. Sulphur is used in the chemical manufacturing industries and to make fertilizer. About 6.4-million tonnes of sulphur were produced in 2013, with a value of $517 million. About 90% of the sulphur production is obtained from sour-gas wells in Alberta and Saskatchewan.
Aggregates include sand, gravel, and other materials that are mined for use in road construction and as fillers for concrete in the construction industry. Aggregates are a low-grade resource, having relatively little value per tonne. However, these materials may be available only in small quantities close to large cities, leading to local shortages. About 228-million tonnes were quarried in 2013, with a value of $1.75 billion. These materials are mined in all provinces and territories, at rates more or less related to the local construction activity.
Peat is a sub-fossil material that has developed from dead plant biomass that is hundreds to thousands of years old. It accumulates in bog wetlands, where it becomes partially decomposed (or humified). Peat is sometimes dried and burned as a source of energy, an important use in Ireland, parts of northern Europe, and Russia. In Canada, however, peat is mined for use as a horticultural material and to produce absorbent hygienic products such as diapers and sanitary napkins. About 1.3-million tonnes of peat were mined in 2013, with a value of $263 million. Most peat mining occurs in New Brunswick and Quebec.
Energy Use
It is critical for any economy to have ready access to relatively inexpensive and accessible sources of energy for commercial, industrial, and household purposes. The use of large amounts of energy is especially characteristic of developed countries, such as Canada. As has been examined previously, relatively wealthy, developed countries use much more energy (on a per-capita basis) than do poorer, less-developed countries.
Ever since people achieved a mastery of fire, they have used fuels for subsistence purposes, that is, to cook food and to keep warm. Initially, locally collected wood and other plant biomass were the fuels used for those purposes. Perhaps only one-million people were alive when fire was first domesticated, and their per-capita energy use was small. Consequently, biomass fuels were a renewable source of energy because the rate at which they were being harvested was much smaller than the rate at which new biomass was being produced by vegetation.
In modern times, however, the human population is enormously larger than it was when fire was first put to work. Moreover, many countries now have intensely industrialized economies in which per-capita energy usage is extremely high. The combination of population growth and increased per-capita energy use means that enormous amounts of energy are used in developed countries. The energy is needed to fuel industrial processes, to manufacture and run machines, to keep warm in winter and cool in summer, and to prepare food.
Most industrial energy supplies are based on the use of non-renewable resources, although certain renewable sources may also be important. For comprehensiveness, both non-renewable and renewable energy sources are discussed together in this section.
Sources of Energy
The world’s major sources of industrial energy are fossil fuels and nuclear fuels, both of which are non-renewable. Hydroelectric power, generated using the renewable energy of flowing water, is also important in some regions, including much of Canada. Relatively minor energy sources, often called “alternative sources”, include biomass fuels, geothermal heat, solar power, wind, and waves, all of which are potentially renewable.
Any of the above sources can be harnessed to drive a turbine, which spins an electrical generator that converts the kinetic energy of motion into electrical energy. Solar energy can also generate electricity more directly, through photovoltaic technology (see below). Electricity is one of the most important kinds of energy used in industrial societies, being widely distributed to industries and homes through a network of transmission lines. The following sections briefly describe how these various energy sources are used.
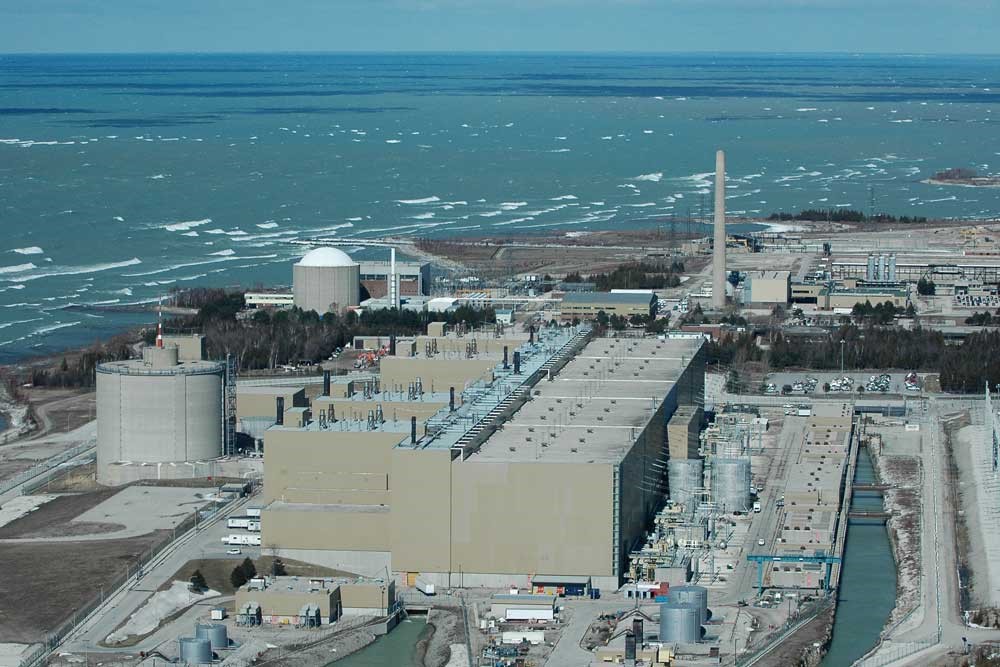
Image 13.4. Electricity generated by sing nuclear fuel or by burning coal, oil, or natural gas uses non-renewable sources of energy. This is an airphoto of the Bruce Nuclear Generating Station in Ontario, with Lake Huron in the background. Source: Chuck Szmurlo, Wikimedia Commons, http://commons.wikimedia.org/wiki/File:Bruce-Nuclear-Szmurlo.jpg
Fossil Fuels
Coal, natural gas, petroleum, and their refined products can be combusted in power plants, where the potential energy of the fuel is harnessed to generate electricity. Fossil fuels can also power machines directly, particularly in transportation, in which gasoline, diesel, liquefied natural gas, and other “portable” fuels are used in automobiles, trucks, airplanes, trains, and ships. Fossil fuels are also combusted in the furnaces of many homes and larger buildings to provide warmth during colder times of the year. The burning of fossil fuels has many environmental drawbacks, including emissions of greenhouse gases, sulphur dioxide, and other pollutants into the atmosphere.
Nuclear Fuels
Nuclear fuels contain unstable isotopes of the heavy elements uranium and plutonium (235U and 239Pu, respectively). These can decay through a process known as fission, which produces lighter elements while releasing 2-3 neutrons per nucleus and an enormous quantity of energy. The emitted neutrons may be absorbed by other atoms of 235U or 239Pu, causing them to also become unstable and undergo fission in a process known as a chain reaction. An uncontrolled chain reaction can result in a devastating nuclear explosion. In a nuclear reactor, however, the flux of neutrons is carefully regulated, which allows electricity to be produced safely and continuously.
Nuclear reactions are fundamentally different from chemical reactions, in which atoms recombine into different compounds without changing their internal structure. In nuclear fission, the atomic structure is fundamentally altered, and small amounts of matter are transformed into immense quantities of energy.
Most of the energy liberated by nuclear fission is released as heat. In a nuclear power plant, some of the heat is used to boil water. The resulting steam drives a turbine, which generates electricity. Most nuclear-fuelled power plants are huge commercial reactors that produce electricity for industrial and residential use in large urban areas (Image 13.4). Smaller reactors are sometimes used to power military ships and submarines, or for research. 235U is the fuel that is used in conventional nuclear reactors, such as the CANDU system developed and used in Canada. 235U is obtained from uranium ore, which is mined in various places in the world. (Canada is a major player in uranium mining, most of which is exported; see Table 13.2.) Uranium produced by refining ore typically consists of about 99.3% non-fissile 238U and only 0.7% 235U. Most commercial reactors require a fuel that has been further refined to enrich the 235U concentration to about 3%. However, the Canadian-designed CANDU reactors can use non-enriched uranium as fuel.
Various elements, most of which are also radioactive (such as radon gas), are produced during fission reactions. One of these, 239Pu, can also be used as a component of nuclear fuel in power plants. To obtain 239Pu for this purpose (or for use in manufacturing nuclear weapons), spent fuel from nuclear generating stations is reprocessed. Other trans-uranium elements and any remaining 235U (as well as non-fissile 238U) can also be recovered and be used to manufacture new fuel for reactors.
So-called fast-breeder reactors are designed to optimize the production of 239Pu (which occurs when an atom of 238U absorbs a neutron to produce 239U, which then forms 239Pu by the emission of two beta electrons). Although fast-breeder reactors have been demonstrated, they have not been commercially developed. Breeder reactors produce “new” nuclear fuel (by producing plutonium) and thereby help to optimize use of the uranium resource. However, there are limits to the process because the original quantity of 238U is eventually depleted. Therefore, both 235U and 239Pu should be considered to be non-renewable resources.
A number of important environmental problems are associated with nuclear power. These include the small but real possibility of a catastrophic accident such as a meltdown of the reactor core, which can result in the release of large amounts of radioactive material into the environment (as happened at the Chernobyl reactor in Ukraine in 1986). Nuclear reactions also produce extremely toxic, long-lived radioactive by-products (such as plutonium), which must be safely managed for very long periods of time (up to tens of thousands of years). Enormous quantities of these “high-level” wastes are stockpiled in Canada and in other countries that use nuclear power, but so far there are no permanent solutions to the problem of their long-term management. Another problem is the emission of toxic radon gas and radioactivity from “low-level” wastes associated with uranium mines, structural elements of nuclear power plants, and other sources.
Fusion is another kind of energy-producing nuclear reaction. This process occurs when light nuclei are forced to combine under conditions of extremely high temperature (millions of degrees) and pressure, resulting in an enormous release of energy. Fusion usually involves the combining of hydrogen isotopes. One common fusion reaction involves two protons (two hydrogen nuclei, 1H) fusing to form a deuterium nucleus (composed of one proton and one neutron, 2H), while also emitting a beta electron and an extremely large amount of energy.
Fusion reactions occur naturally in the interior of the Sun and other stars, and they can also be initiated by exposing hydrogen to the enormous heat and pressure generated by a fission nuclear explosion, as occurs in a so-called hydrogen bomb. However, nuclear technologists have not yet designed a system that can control fusion reactions to the degree necessary to generate electricity in an economic system. If this technology is ever developed, it would be an enormous benefit to industrial society. It would mean that virtually unlimited supplies of hydrogen fuel for fusion reactors could be extracted from the oceans, which would essentially eliminate constraints on energy supply. So far, however, controlled fusion reactions remain the stuff of science fiction.
Hydroelectric Energy
Hydroelectric energy involves harnessing the kinetic energy of flowing water to drive a turbine that generates electricity. Because the energy of flowing water develops naturally through the hydrologic cycle, hydroelectricity is a renewable source of energy. There are two classes of technologies for the generation of hydroelectricity.
- Run-of-the-river hydroelectricity involves tapping the natural flow of a watercourse without developing a large up-river storage reservoir. Consequently, this electricity generation depends on the natural patterns of river flow and is highly seasonal.
- Reservoir-generated hydroelectricity involves the construction of a dam in a river to store a huge quantity of water in a lake-like waterbody. The reservoir accumulates part of the seasonal high flow so that the generation of electricity can occur relatively steadily throughout the year. Some enormous reservoirs have been developed by flooding extensive tracts of land that had previously been covered by forest and wetlands in various places in Canada, such as in British Columbia, Labrador, Manitoba, and Quebec.
Canada’s largest hydroelectric generating facilities are located Churchill Falls in Labrador with a capacity of 5,429 megawatts (MW), La Grande-2 in northern Quebec with 5,328 MW, G.M. Shrum in British Columbia with 2,730 MW, and La Grande 4 and 3 in Quebec, with 2,651 and 2,304 MW, respectively. All of these facilities have large reservoirs to store water. Although hydroelectric energy is renewable, important environmental impacts are associated with use of this technology. Changes in the amount and timing of water flow in rivers cause important ecological damages, as does the extensive flooding that occurs when a reservoir is developed (see Chapter 20).
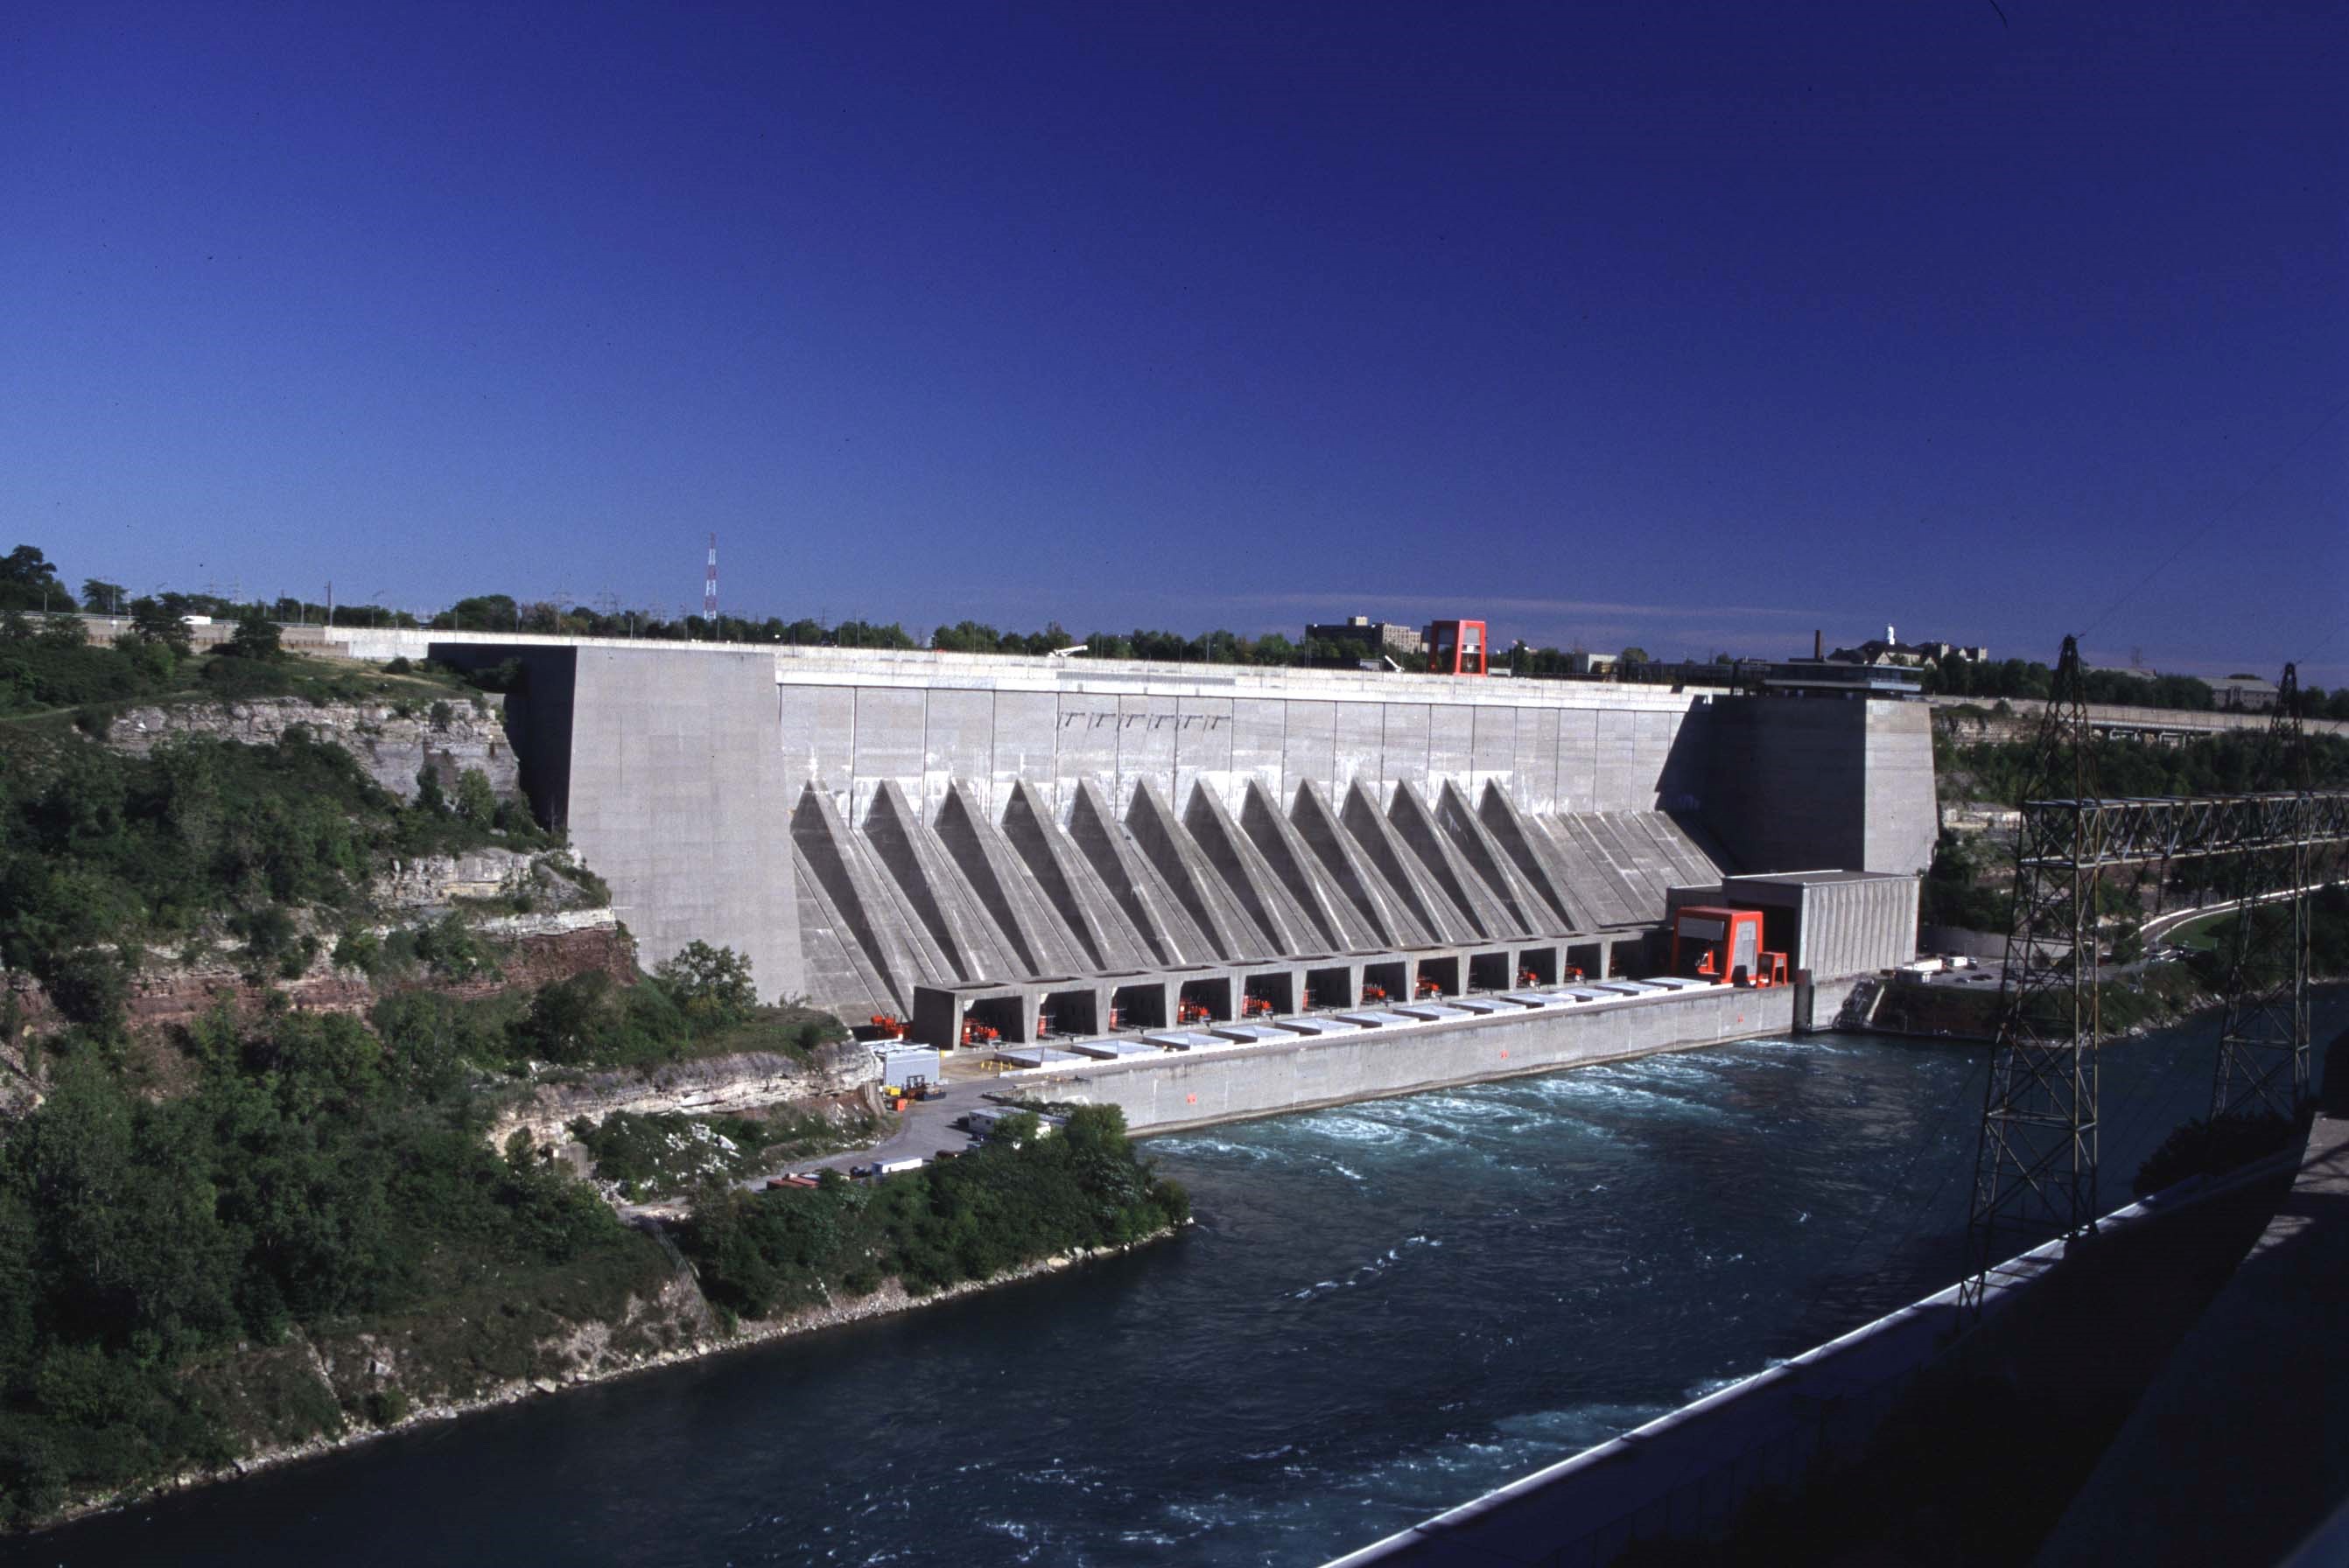
Image 13.5. Hydroelectricity is a renewable source of energy. This facility taps part of the flow of the Niagara River to generate electricity. Source: B. Freedman.
Solar Energy
Solar energy is continuously available during the day, and it can be tapped in various ways as a renewable source of energy. For example, it is stored by plants as they grow, so that their biomass can be harvested and combusted to release its potential energy (see Biomass Energy, below).
Solar energy can also be trapped within a glass-enclosed space. This happens because glass is transparent to visible wavelengths of sunlight, but not to most of the infrared. This allows the use of passive solar or “greenhouse” designs to heat buildings. Solar energy can also be captured using black, highly absorptive surfaces to heat enclosed water or another fluid, which can then be distributed through piping to warm the interior of a building.
Solar energy can also be used to generate electricity using photovoltaic technology (solar cells), which converts electromagnetic energy directly into electricity. In another technology, large, extremely reflective parabolic mirrors are used to focus sunlight onto an enclosed volume that contains water or another fluid, which becomes heated and generates steam that is used to drive a turbine to generate electricity.
Geothermal Energy
Geothermal energy can be tapped in the very few places where magma occurs relatively close to the surface and heats ground water. The boiling-hot water can be piped to the surface, where its heat content is used to warm buildings or to generate electricity. In addition, the smaller energy content of slightly warmed geothermal water, which is present almost everywhere, can be accessed using heat-pump technology and used for space heating or to provide warm water for a manufacturing process. Geothermal energy is a renewable source as long as the supply of groundwater available to be heated within the ground is not depleted by excessive pumping.
Wind Energy
The kinetic energy of moving air masses, or wind energy, can be tapped and used in various ways. A sailboat uses wind energy to move through the water, a windmill may be used to power the lifting of groundwater for use at the surface, and wind turbines are designed to generate electricity. Extensive wind-farms, consisting of arrays of highly efficient wind-driven turbines, have been constructed to generate electricity in consistently windy places in many parts of the world. In 2014, Canada had an installed wind-farm capacity of 8,517 MW, of which 24 had a capacity of greater than 100 MW (Canadian Wind Energy Association, 2014). The largest wind-farms are Seigneurie de Beaupré (QC, 272 MW), Gros-Morne (QC, 212 MW), Amaranth (ON, 200 MW), and Wolfe Island (197 MW).
Image 13.6. Wind is increasingly being used as a source of commercial energy in Canada. These wind turbines are operating near Tilbury in southwestern Ontario. Source: B. Freedman.

Tidal Energy
Tidal cycles develop because of the gravitational attraction between Earth and the Moon. In a few coastal places, tidal energy, the kinetic energy of tidal flows, can be harnessed to drive turbines and generate electricity. The Bay of Fundy in eastern Canada has enormous tides, which can exceed 16 m at the head of the bay. A medium-scale (20 MW) tidal-power facility has been developed at Annapolis Royal in Nova Scotia. There is potential for much more tidal power development within the Bay of Fundy, and there are ongoing technological studies to install additional facilities at various places there. The new installations will use tidal-powered turbines that are laid on the bottom or suspended in the water column, which avoids the environmental damage associated with a dam.
Wave Energy
Waves on the ocean surface are another manifestation of kinetic energy. Wave energy can be harnessed using specially designed buoys that generate electricity as they bob up and down, although this technology has not yet been developed on a commercial scale.
Biomass Energy
The biomass of trees and other plants contains chemical potential energy. This biomass energy is actually solar energy that has been fixed through photosynthesis. Peat, mined from bogs, is a kind of sub-fossil biomass.
Like hydrocarbon fuels, biomass can be combusted to provide thermal energy for industrial purposes and to heat homes and larger buildings. Biomass can also be combusted in industrial-scale generating stations, usually to generate steam, which may be used to drive a turbine that generates electricity. Biomass can also be used to manufacture methanol, which can be used as a liquid fuel in vehicles and for other purposes.
If the ecosystems from which biomass is harvested are managed to allow post-harvest regeneration of the vegetation, this source of energy can be considered a renewable resource. Peat, however, is always mined faster than the slow rate at which it accumulates in bogs and other wetlands, so it is not a renewable source of biomass energy.
Energy Consumption
The consumption of energy varies greatly among countries, largely depending on differences in their population and degree of development and industrialization (Table 13.8). In general, the per-capita use of primary energy (this refers to fuels that are commercially traded, including renewables used to generate electricity) in less-developed countries is less than about 1 toe per person per year. However, in the less-developed countries there is a relatively larger use of non-commercial or “traditional” fuels for purposes of subsistence and local commerce, such as wood, charcoal, dried animal manure, and food-processing residues such as coconut shells and bagasse (a residue of sugar cane pressing). The use of traditional fuels is not reflected in the data of Table 13.8.
Countries that are developing rapidly are intermediate in their per-capita energy consumption, but their rates of energy use are increasing rapidly due to their industrialization. In Malaysia, for example, the national consumption of primary energy increased by 167% between 1993 and 2013, while in South Korea it increased by 118%, in China by 270%, in India by 189%, and in Brazil by 103% (by comparison, the growth was 17% in Canada and 11% in the U.S.; WRI, 2014). While the use of energy has grown in these and other rapidly developing countries, their reliance on traditional fuels has dropped. This happens because traditional fuels are relatively bulky, smoky, and less convenient to use than electricity or fossil fuels, particularly in the urban environments where people are living in increasingly large numbers. In addition, the supplies of wood, charcoal, and other traditional fuels have become severely depleted in most rapidly developing countries, particularly near urban areas.
Relatively developed countries have a high per-capita consumption of energy (Table 13.8). Their energy use is typically more than 3 toe/person and almost entirely involves electricity and fossil fuels. The world’s most energy-intensive economies, on a per-capita basis, are those of Canada and the United States (9.38 and 7.13 toe/person, respectively) , which have more than 40-50 times the per-capita usage of people living in the least-developed economies of the world.
Table 13.8. Consumption of Primary Energy in Selected Countries in 2013. Primary energy refers to fuels that are commercially traded, including renewables used to generate electricity. National energy consumption mostly reflects the size of the economy of a country and its population, while per-capita use allows for a comparison of the lifestyle-intensity of average people. Source: Data from BP (2014).
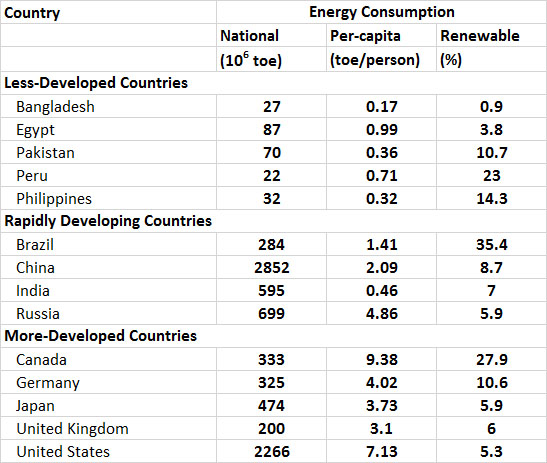
In terms of the total amounts of energy being used, the largest consumers are China (2,852 toe in 2013), the United States (2,266), and Russia (699 toe). Canada is a highly developed country, but because of moderately-sized population and economy, it uses considerably less energy in total, about 333 toe.
The use of commercial energy in Canada increased by 116% between 1965 and 1990, and by 33% between 1990 and 2013, while per-capita consumption increased by 54% and 4% during the same periods, respectively (Figure 13.2). The fact that per-capita energy use increased much less quickly than national consumption suggests that Canadians have become more efficient in their use of energy, especially during the more recent period. Smaller automobiles, improved gas economy of vehicles, better insulation of residences and commercial buildings, and the use of more efficient industrial processes have all contributed to this increased efficiency. Nevertheless, although these gains of energy efficiency have been substantial, they have been more than offset by growth in the per-capita ownership of automobiles, consumer electronics, and other energy-demanding products and technologies. Also important have been large increases in industrial energy use associated with oil-sands developments in Alberta during the past several decades. These latter changes have caused the overall use of energy in Canada to increase substantially.
Figure 13.2. Trends in the Consumption of Primary Energy in Canada. Note the different scales of national energy consumption (1018 J) and per capita consumption (1012 J/person). Sources: Data from British Petroleum (2013).

The intensive energy usage by Canadians reflects the high degree of industrialization of our national economy. Also significant is the relative affluence of average Canadians (compared to the global average). Wealth allows people to lead a relatively luxurious lifestyle, with ready access to energy-consuming amenities such as motor vehicles, home appliances, space heating, and air conditioning. Canada is also a large country, so there are relatively large expenditures of energy for travelling. In addition, the cold winter climate means that people use a great deal of energy to keep warm.
Energy Production
As was examined in Chapter 12, a sustainable enterprise cannot be supported primarily by the mining of non-renewable sources of energy or other resources. Therefore, a sustainable economy must be based on the use of renewable sources of energy.
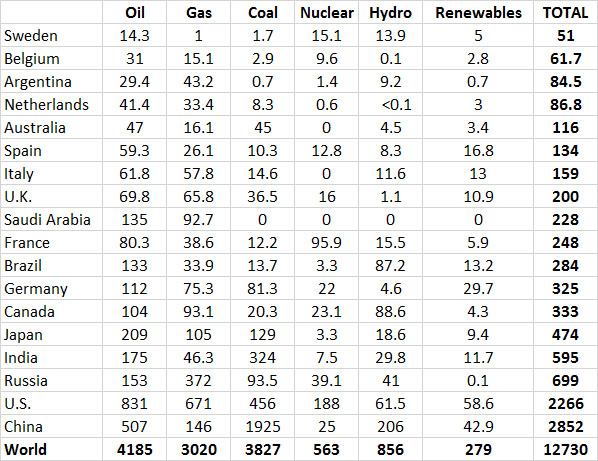
However, most energy production in industrialized countries is based on non-renewable sources. Averaged across the relatively developed countries shown in Table 13.9, non-renewable fossil fuels and nuclear power account for 91% of the total use of energy. Renewable sources, such as hydroelectric, geothermal, solar, wind, and biomass fuels, account for only about 9%. With such a small reliance on non-renewable sources, it is clear that the major economies of the world are not close to having developed sustainable energy systems. Considering the rapid rate at which reserves of non-renewable energy resources are being depleted, one wonders how long the energy-intensive economies of developed nations can be maintained.
Table 13.9. Energy Consumption in Selected Countries in 2013. Data are in units of 106 tonnes of oil equivalent. Source: Data from British Petroleum (2014).
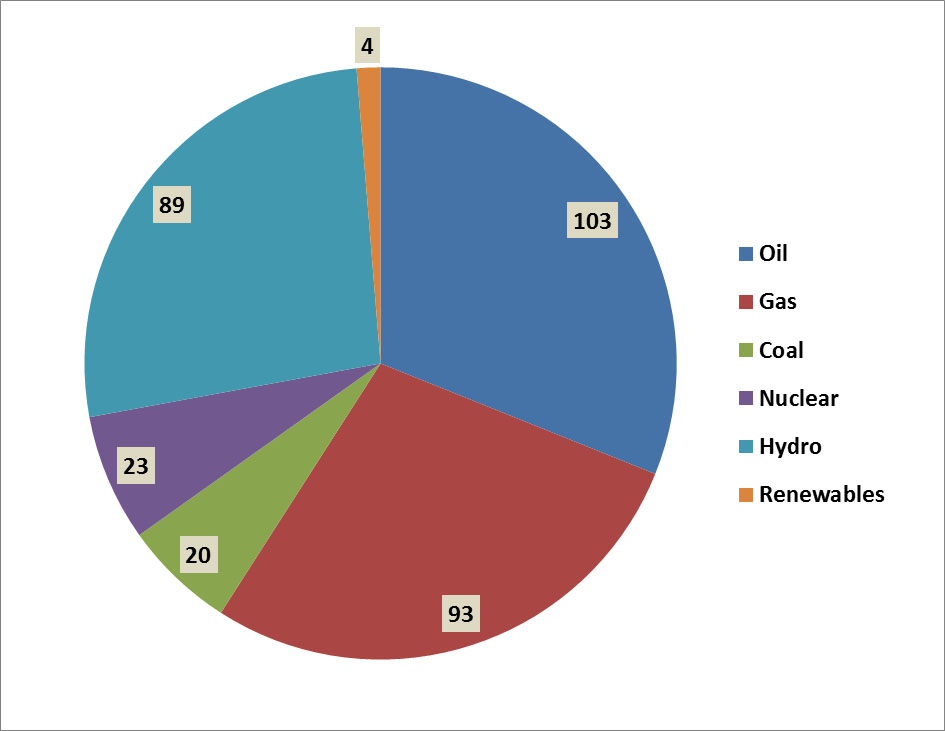
Of Canada’s total consumption of primary energy in 2013, 31% came from petroleum, 28% came from natural gas, 6% from coal, and 7% from nuclear energy (Figure 13.3). These non-renewable energy sources account for 72% of the total use of primary energy in Canada. Most of the remaining production comes from hydroelectricity (27%), which is renewable (although it can cause substantial environmental damage through flooding to create reservoirs, and can require large amounts of non-renewable resources for the construction of dams, transmission lines, and related infrastructure; see Chapter 20). Another 1.3% involves the use of other renewable sources of energy, such as wind and biomass. There are also, of course, environmental impacts of the harvesting of trees and other kinds of biomass for use as fuel (see Chapter 23).
Figure 13.3. Sources of Primary Energy in Canada. Overall, about 86% of commercial energy consumption is derived from non-renewable sources. The data are for 2006 and are in units of 106 tonnes of oil equivalent. Biomass includes both solid and liquid forms, and “other renewables” includes geothermal, solar, and wind. Source: Data from British Petroleum (2008)
Electricity produced by public or private utilities accounts for much of the energy used by industry, institutions, and residences in Canada. About 61% of the 615-million MW-hours of electricity produced in 2012 was generated from hydroelectric utilities, 22% from fossil-fuelled sources, and 15% by nuclear technology (Statistics Canada, 2013). Within the renewable sector, hydro accounted for 96% of the electricity production, wind for 3%, and others for 1%.
Conclusions
Non-renewable resources are always diminished as they are used. Although non-renewables can be used with great enthusiasm to achieve economic growth, they cannot be the basis of a sustainable economy. Only renewable resources can play that fundamental role. In this chapter we learned that the non-renewable resources that are vital to the functioning of modern “advanced” economies, such as that of Canada, are being rapidly depleted. For instance, the life index of the global reserves of copper is only about 39 years, while that of nickel is 30 years, and zinc 19 years. Among fossil fuels, the life index of the global reserves of petroleum is about 58 years, while that of natural gas is 55 years, and coal 113 years. While it is true that continuing exploration will find additional reserves of these and other non-renewable resources, there are limits to those further discoveries. In addition, about 72% of the consumption of primary energy in Canada is based on non-renewable sources, as is 39% of the electricity generation. Because the reserves of all non-renewable resources are being depleted rapidly, both in Canada and around the world, the longer-term sustainability of the energy-intensive economies of developed countries, and the lifestyles of their citizens, is highly doubtful.
Questions for Review
- Using information from this chapter, describe the Canadian and global production and use of non-renewable resources.
- Show how industrialized countries rely mostly on non-renewable resources to sustain their economies. Will this kind of resource use be able to continue for very long? Why or why not?
- What are the various non-renewable and renewable sources of energy available for use in industrialized countries? What are the future prospects for increasing the use of renewable sources?
- What are the key sources of energy and materials that are ultimately based on sunlight? Which of these resources would you consider to be renewable, and which not?
Questions for Discussion
- Outline the ways in which you use energy, both directly and indirectly. For each of your major uses, how could you decrease your energy consumption? How would a decrease in energy consumption affect your lifestyle?
- What are the apparent barriers to the widespread adoption of renewable sources of materials and energy in advanced economies (such as Canada)?
- What are the roles of non-renewable and renewable resources in a sustainable economy?
- Biomass, wind, and hydroelectricity are all examples of renewable sources of energy. Examine the energy-source distributions for several countries in Table 13.9 and discuss why they are not relying more on renewable sources of energy.
- Make lists of the apparent benefits and risks associated with nuclear power. Focus on resource and environmental issues, such as the depletion of fossil fuels, emissions of greenhouse gases, and the long-term disposal of toxic and hazardous wastes.
Exploring Issues
- A committee of the House of Commons is examining the sustainability of the Canadian economy. You are an environmental scientist, and the committee has asked you to advise them on improving the sustainability of the use of materials and energy. What would you tell them about the sustainability of present use? What improvements would you recommend?
References Cited and Further Reading
Alberta Energy. 2008. Alberta’s Oil Sands. https://web.archive.org/web/20160505003335/http://oilsands.alberta.ca/
British Petroleum (BP). 2014. Statistical Review of World Energy, 2014. https://web.archive.org/web/20141025054702/http://www.bp.com/en/global/corporate/about-bp/energy-economics/statistical-review-of-world-energy.html
Canadian Nuclear Association. 2005. Nuclear Energy. https://cna.ca/
Canadian Association of Petroleum Producers (CAPP). 2014. Statistics Handbook. http://www.capp.ca/library/statistics/handbook/Pages/default.aspx Accessed November, 2014.
Canadian Wind Energy Association. 2014. Installed Capacity. http://canwea.ca/wind-energy/installed-capacity/ Accessed November, 2014.
Chiras, D.D., and J.P. Reganold. 2009. Natural Resource Conservation: Management for a Sustainable Future. 10th ed. Prentice Hall, Upper Saddle River, NJ.
Craig, J.R., D.J. Vaughan, B.J. Skinner, and D. Vaughan. 2001. Resources of the Earth: Origin, Use, and Environmental Impact. 3rd ed. Prentice Hall, Upper Saddle River, NJ.
Freedman, B. 1995. Environmental Ecology, 2nd ed. Academic Press, San Diego, CA.
Freedman, B., J. Hutchings, D. Gwynne, J. Smol, R. Suffling, R. Turkington, R. Walker, and D. Bazeley. 2014. Ecology: A Canadian Context. 2nd ed. Nelson Canada, Toronto, ON.
Harris, J.M. and B. Roach. 2014. Environmental and Natural Resource Economics: A Contemporary Approach. 3rd ed. Routledge, New York, NY.
Holechek, J.L., R.A. Cole, J.T. Fisher, and R. Valdez. 2002. Natural Resources: Ecology, Economics, and Policy. 2nd ed. Prentice Hall, East Rutherford, NJ.
Natural Resources Canada (NRC). 2014a. Mineral Production of Canada, by Province and Territory. NRC, Ottawa, ON. http://sead.nrcan.gc.ca/prod-prod/ann-ann-eng.aspx
Natural Resources Canada (NRC). 2014b. About Coal. NRC, Ottawa, ON. http://www.nrcan.gc.ca/energy/coal/4277
Ripley, E.A., R.E. Redmann, and A.A. Crowder. 1996. Environmental Effects of Mining. St. Lucie Press, Delray Beach, FL.
Statistics Canada. 2013. Table 127-0007. Electric power generation, by class of electricity producer. Table 127-0007, Statistics Canada, Ottawa, ON. http://www5.statcan.gc.ca/cansim/a26?lang=eng&retrLang=eng&id=1270007&&pattern=&stByVal=1&p1=1&p2=-1&tabMode=dataTable&csid=
Statistics Canada. 2014a. Gross domestic product (GDP) at basic prices, by North American Industry Classification System (NAICS), annual (dollars). Table 379-0029, CANSIM database. Statistics Canada, Ottawa, ON. http://www5.statcan.gc.ca/cansim/a26?lang=eng&retrLang=eng&id=3790029&&pattern=&stByVal=1&p1=1&p2=1&tabMode=dataTable&csid= Accessed November, 2014.
Statistics Canada. 2014b. Report on Energy Supply and Demand in Canada, 2012 Preliminary. 57-003-X, Statistics Canada, Ottawa, ON. http://www.statcan.gc.ca/pub/57-003-x/57-003-x2014002-eng.pdf
Statistics Canada. 2014c. Supply and disposition of crude oil and equivalent, monthly (cubic metres). Table 126-0001, CANSIM database. http://www5.statcan.gc.ca/cansim/a26?lang=eng&retrLang=eng&id=1260001&paSer=&pattern=&stByVal=1&p1=1&p2=-1&tabMode=dataTable&csid= Accessed November, 2014.
Tietenberg, T. and L. Lewis. 2011. Environmental and Natural Resource Economics.9th ed.. Addison Wesley, Boston, MA.
United States Geological Service. 2014. Mineral Commodity Summaries 2014. http://minerals.usgs.gov/minerals/pubs/mcs/